Solar Power Costs in Australia: Full 2026 Breakdown
Getting a solar quote in Australia feels a lot like buying a car. Nobody leads with the actual price. You get a call, a site visit, a glossy brochure, and eventually a number that you have no real way to evaluate, all for a decision worth $5,000 to $10,000.
Solar power costs in Australia in 2026 are among the lowest in recent years. The federal rebate is still active, installation competition has driven prices down in most states, and panels themselves are cheaper per watt than at almost any point in the technology’s history. But the gap between a fair deal and an overpriced one is still wide enough to matter. A poorly sized system or an inflated quote can cost you thousands.
This article covers the actual numbers: upfront costs by system size and state, the rebates still worth claiming, what battery storage adds to the bill, and realistic payback timelines. Before you sign anything, check your installer’s quote against independent pricing benchmarks at NameTheCost.com, a cost and pricing directory where you can see what the market is actually charging for solar installation in your state in 2026. It’s a practical way to separate a fair price from an inflated one before you commit.
What solar power actually costs in 2026
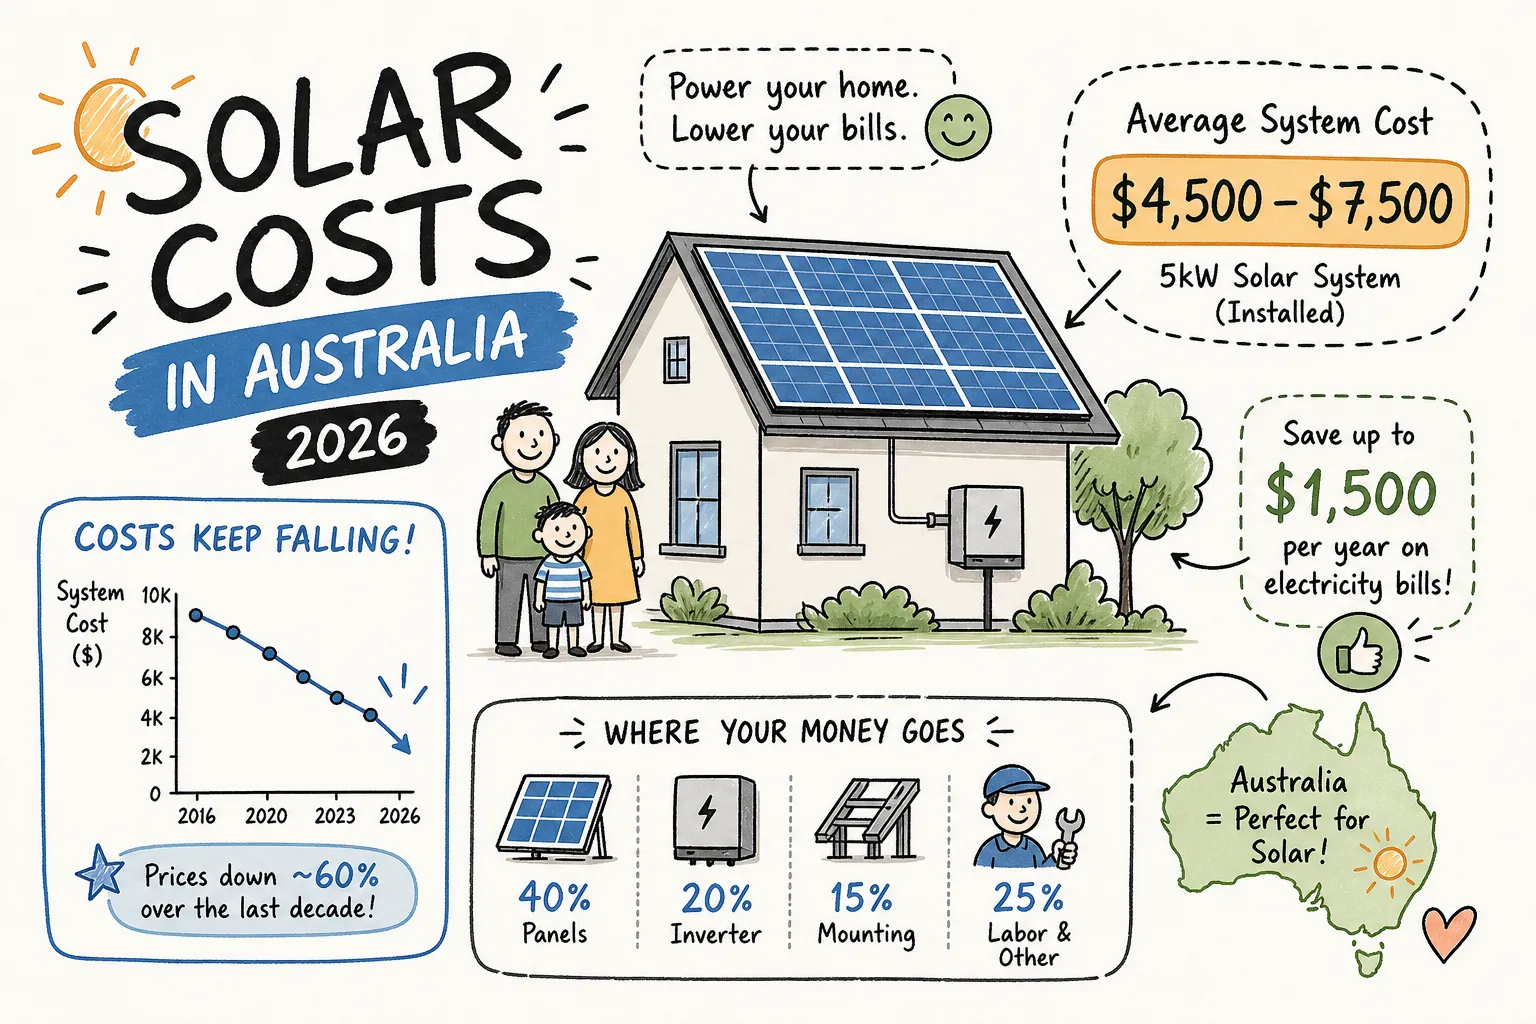
The installed cost of rooftop solar in Australia sits at roughly $880 to $950 per kilowatt in 2026, after the federal STC discount is applied. That puts a 6.6kW system, the most popular size for a three-bedroom home, at around $5,000 to $6,500 fully installed. A 10kW system typically lands between $8,000 and $10,500. These are post-rebate, market-rate figures from 2026 pricing guides, not promotional best-case numbers.
Price by system size: what each option suits
| System size | Installed price range | Best suited to |
|---|---|---|
| 3kW | $3,260, $4,530 | Single person, couple, or small unit with modest energy use |
| 5kW | $4,080, $8,470 | Average family home with one or two people home during the day |
| 6.6kW | $5,136, $9,852 | Sweet spot for most households; most competitive installer pricing bracket |
| 10kW | $7,800, $14,960 | Larger households or anyone working from home with consistently high daytime consumption |
The $880 per kW benchmark and what it really means
The per-kilowatt figure is a useful sanity-check tool, not a guarantee. If you receive a quote that works out significantly above $1,000 per kW after the STC rebate, ask why. Panel brand, inverter quality, and roof complexity all legitimately push costs higher. But the per-kW metric is a fast filter for spotting inflated quotes before you get too far into the process. Run the maths on any quote you receive before you commit to the installer.
Why rooftop solar prices vary so much across states
Australians in different states pay meaningfully different prices for identical system sizes, and the gap is larger than most people expect. Western Australia and NSW consistently sit at the cheaper end of the market. The Northern Territory and Tasmania are the most expensive, in some cases, NT pricing for a 10kW system is significantly higher than what you’d pay in Perth or Sydney, driven by thin installer competition, remote logistics, and grid connection complexity.
State-by-state price snapshot for 2026
| State/Territory | 6.6kW installed price | 10kW installed price |
|---|---|---|
| NSW | $5,836 | , |
| VIC | $6,020 | , |
| QLD | $6,234 | , |
| SA | $6,145 | , |
| WA | $5,136 | , |
| ACT | $5,904 | $7,800 |
| TAS | $7,462 | , |
| NT | $9,852, $9,890 | $14,930, $14,960 |
Perth delivers the cheapest installed cost per kilowatt for a 6.6kW system at around $618 per kW, while Darwin sits at roughly $1,283 per kW, nearly double. Those are the two extremes, but the difference between NSW and Tasmania is still significant enough to affect your overall return on investment.
What drives the price gap beyond geography
Installer competition is the biggest non-geographic factor. States with more accredited installers competing for the same customers tend to have lower margins and sharper pricing. Grid connection fees and metering upgrade requirements vary by state and network, and these costs sometimes sit outside the headline quote. Feed-in tariff rates also influence the long-run economics: a state with better export rates improves the financial case for solar even when the upfront cost is higher.
Rebates and incentives still worth claiming in 2026
The federal Small-scale Renewable Energy Scheme (SRES) is the main upfront incentive for rooftop solar across Australia. It works as a point-of-sale discount: your installer claims the small-scale technology certificates (STCs) on your behalf and subtracts the value from your invoice before you pay. You don’t apply for it separately. It’s built into every compliant quote automatically.
The deeming period for systems installed in 2026 is five years, dropping to four years on 1 January 2027. That reduction lowers the STC count and the rebate value in real terms. For a 6.6kW system in Sydney, a 2026 install earns around 45 STCs worth approximately $1,796. The same system installed in 2027 earns 36 STCs worth roughly $1,436, a difference of around $360. It’s not a reason to rush into a bad deal, but it is a real and specific cost of deferring the decision.
State-level rebates: what’s still open and what’s closed
Victoria’s Solar Homes rebate remains active at up to $1,400, with an optional matching $1,400 interest-free loan. The household income cap tightened to $150,000 from 1 July 2026. NSW offers a Home Energy Saver interest-free loan of up to $15,000 over 10 years for households earning up to $210,000. South Australia’s REPS battery incentive has narrowed to priority groups only after general funding ran out in May. Most other states rely solely on the federal STC discount for panels, with no additional state-level panel rebate currently active.
Feed-in tariffs: don’t bank on them alone
Western Australia’s Distributed Energy Buyback Scheme pays export rates up to around 10 cents per kWh at peak times. Tasmania has a regulated minimum of 8.782 cents per kWh. Rates elsewhere are largely retailer-set and vary by plan, with some NSW and Victorian plans paying between 3 and 10 cents depending on the retailer and time of export. Feed-in tariff rates have fallen in most states over recent years. Size your system around your own daytime consumption, not maximum export.
Adding battery storage: honest numbers for 2026
Batteries are getting cheaper, but they’re still expensive enough to materially change your payback calculation. Residential battery storage costs roughly $380 to $1,250 per usable kilowatt-hour in 2026, depending on brand, capacity, and installation complexity. A 10kWh battery system typically adds $8,000 to $11,000 to the project cost before incentives.
Under the federal Cheaper Home Batteries Programme, a 10kWh system generally lands at around $7,000 to $9,500 installed after the discount. The federal rebate for a 10kWh battery in 2026 is commonly estimated at $3,100 to $3,700, though the subsidy stepped down from 1 May 2026 and continues to taper.
What battery capacity a typical home actually needs
A 10kWh battery covers most of a typical household’s evening and overnight consumption when paired with a 6.6kW or larger solar system. Larger systems sometimes justify a 13.5kWh battery, but oversizing battery capacity relative to your solar generation is a common and expensive mistake. More capacity raises upfront cost without proportionally increasing bill savings if the extra kilowatt-hours simply sit unused overnight.
How batteries affect your payback period
For most households, adding a battery extends the payback period compared to solar-only. The exception is households on a steep time-of-use tariff with a significant gap between peak and off-peak rates. When a battery can charge from cheap off-peak solar and discharge during expensive evening peak periods, the financial case improves substantially. Without that tariff structure, the simpler economics of a solar-only system deliver faster payback and a cleaner return on investment.
How long before solar pays for itself
For a standard 6.6kW system installed in 2026, the typical payback period across Australia sits between four and six years, with South Australia, Western Australia, and Queensland seeing payback as fast as two to four years due to high electricity tariffs and strong solar irradiance. Victoria and Tasmania run slower, at four to eight years, reflecting lower grid tariffs and less available sunlight. After payback, quality panels carry a 25-year performance warranty, which means most households are looking at 19 to 21 years of effectively free solar generation once they’ve cleared the break-even point.
What speeds up payback and what slows it down
High daytime electricity consumption is the single biggest accelerator. Every kilowatt-hour of solar used directly displaces power bought from the grid at typical retail rates, often 30 to 40 cents or more per kWh depending on your state and plan. Running the dishwasher, washing machine, or air conditioning during daylight hours shifts consumption into the solar window and compounds your savings. Oversizing a system beyond daytime needs and relying on low feed-in export rates slows payback considerably. Adding a battery without a time-of-use tariff advantage delays the break-even point further.
The realistic return over the panel’s lifetime
Consider a $6,000 system saving $1,500 per year in electricity costs. It pays back in four years. Over 25 years, assuming modest output degradation and one inverter replacement, cumulative net savings typically reach around $28,000, locking in energy at a fixed capital cost while grid electricity prices continue rising. The long-run financial case for rooftop solar in 2026 is solid, provided the system is correctly sized and the quote reflects actual market pricing.
Getting a fair quote without being overcharged
Many households get one or two installer quotes and accept the lower one. In practice, that’s picking the less expensive of two unknown quantities with no independent reference point. The per-kW benchmark changes that. Once you know that 2026 market pricing for a 6.6kW system in your state sits around $5,000 to $6,500 installed, any quote significantly above that range needs a clear, specific explanation from the installer.
Three things to check before accepting any quote
- Is the price before or after the STC rebate? Some installers quote pre-rebate figures to look more competitive, then apply the discount at signing. Always ask for the post-STC installed price.
- What inverter brand and panel model are specified? A premium inverter from a reputable brand justifies a higher price. A vague “Tier 1 panel” claim without a model number does not.
- Does the quote include grid connection and metering? Metering upgrades are required in most states when installing solar, and they cost money. If they’re not in the quote, they’ll appear on a separate bill later.
Using independent pricing data as your benchmark
Before accepting any quote, check the independent cost benchmarks at NameTheCost.com to see what the market is actually charging for solar installation in your state by system size in 2026. It’s a practical way to separate a fair price from an inflated one, without needing to become a solar expert. With a reliable benchmark in hand, negotiating with installers becomes a more confident conversation.
Solar power costs in Australia in 2026 are genuinely reasonable. The federal rebate is real, the payback period for most households sits well inside a decade, and the long-run return is difficult to argue with. The decisions that actually matter are choosing the right system size, determining whether battery storage makes financial sense for your tariff structure, and ensuring the quote you accept reflects what the market is actually charging. Check the benchmarks at NameTheCost.com before you pick up the phone, it takes five minutes and gives you a concrete number to negotiate from.